Lab 4: Impulse and Momentum Lab
Impulse Lab
Momentum Bar Chart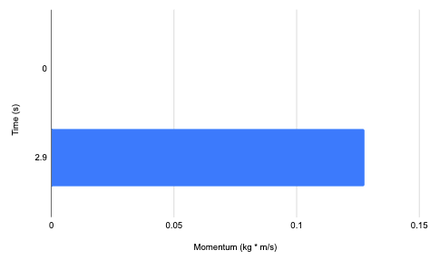
Momentum - Time Graph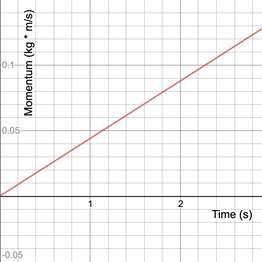
CalculationsA motion sensor was used to obtain the position of the cart at each measurement of time. Since the cart was sliding on a near-frictionless surface, after the cart was given an initial push it should have retained a relatively constant velocity. However, a constant force was being exerted on the cart-track system. Due to this, a quadratic relationship was found on the cart throughout the time period, and the velocities in these segments were considered to be linear. The total momentum of the system should have been equal before and after the collision, shown by the equations (Pi = Pf) and (M * Vi = M * Vf). However, due a constant force being exerted on the cart-track system, the initial and final momentums were not the same. The change in momentum is called the impulse, and the new equations are (Pi + J = Pf) and (M * Vi + F * t= M * Vf). In the second equation, impulse is equal to the force on the system multiplied by the time. 0.252 kg was substituted for M. In this trial, Vi = 0 m/s, Vf = 0.5064 m/s. The initial momentum is 0 kg * m/s, and the final momentum is 0.12761 kg * m/s.
|
Position - Time Graph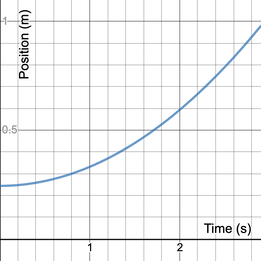
Force - Time Graph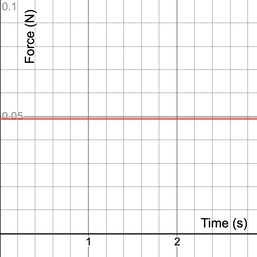
Percent DifferenceThe percent difference is a decent indicator on the reliability of data. The lower the percent difference, the lower the amount of error in the experiment and the more reliable the results. The equation to calculate the percent difference is ((|Impulse from calculations - Impulse from Force vs. Time graph|) / Impulse from Force vs. Time graph). To get the initial and final momentum, the cart's momentum must be calculated. In this trial the initial momentum is 0 kg * m/s and the final momentum is 0.12761 kg * m/s. The percent difference in this trial was 9.15%.
|
Discussions
The objective of this trial was to see if the change in momentum was equal to the impulse of the experiment. A momentum-time graph could be created using the position-time graph and the mass of the carts.A force-time graph could be created as well, and the slope of the line is zero because the external force acting on the cart-track system was constant at 0.049 N. If the momentum was completely conserved and the experiment was free from error, then the impulse calculated from the equations in the "Calculations" section above and the area under the Force-time graph would be equal, since impulse should equal the force acting on the system multiplied by the time of interaction. However, this experiment was far from perfect and the values of each impulse calculation were not equal. The percent difference was within a reasonable range, and therefore the slight difference in the values can be attributed to errors in the experiment. Possible sources of uncertainty in the experiment could be that the tracks are not perfectly frictionless. This could affect the data by reducing the velocity of the cart, and would therefore skew the data to have a lower momentum, causing the impulse values to vary. Another possible source of uncertainty is friction in the pulley system. The cart was pulled horizontally along the track by a pulley that had a weight attached and traveling vertically. If there was friction in the pulley, it would have decreased the velocity of the cart and caused the impulse values to vary.
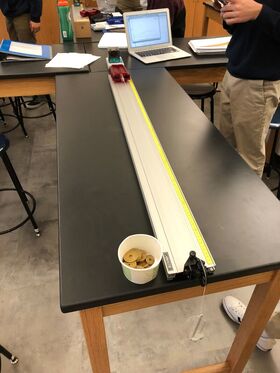
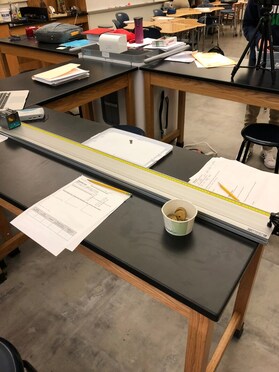
Pictures of Experiment
|
|
Widget is loading comments...
Momentum Lab
Trial 1 - Bouncy collision with one cart moving and one stationary
Momentum Bar Chart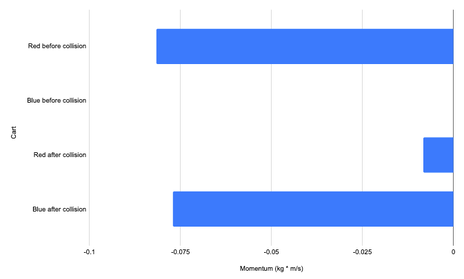
Momentum - Time Graph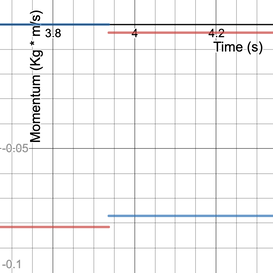
CalculationsLogger Pro Software was used to obtain the position of each cart at each measurement of time. Since the carts were sliding on a near-frictionless surface, after the cart was given an initial push it retained a relatively constant velocity until the collision. Due to this, a linear relationship was found on each cart before and after the collision, and the velocities in these segments were considered to be constant. The total momentum of the system should have been equal before and after the collision, shown by the equations (Pi = Pf) and (Ma * Vai + Mb * Vbi = Ma * Vaf + Mb * Vbf). After substituting in 0.252 kg for both Ma and Mb, since the carts had equal mass. In this trial, Vai = -0.3239 m/s, Vbi = 0 m/s, Vaf = -0.01317 m/s, and Vbf = -0.3060 m/s. The initial total momentum is -0.0816 kg * m/s, and the final total momentum is -0.0884 kg * m/s.
|
Position - Time Graph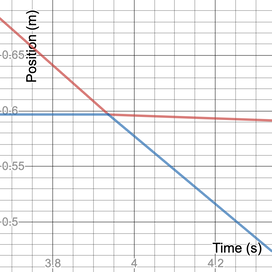
Net Momentum - Time Graph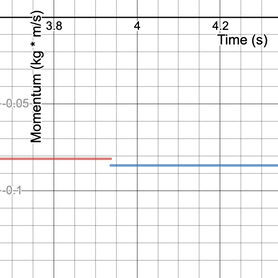
Percent DifferenceThe percent difference is a decent indicator on the reliability of data. The lower the percent difference, the lower the amount of error in the experiment and the more reliable the results. The equation to calculate the percent difference is ((|final momentum - initial momentum|) / initial momentum). To get the initial and final momentum, the two carts' momentum of either before or after the collision must be added. In this trial the initial momentum is -0.0816 kg * m/s and the final momentum is -0.0771 kg * m/s. The percent difference in this trial was 5.51%.
|
Discussions
The objective of this trial was to see if momentum was conserved when a moving cart collided with a stationary cart in an elastic collision. Using the slope of the lines in the position-time graph and the mass of the carts, a momentum-time graph could be created. From this, the total momentum before and after the collision can be found and put into a net momentum-time graph. If the momentum was completely conserved and the experiment was free from error, then the momentum before the collision would be equal to the momentum after the collision, and the net momentum-time graph would be continuous. However, this experiment was far from perfect and the graph was not continuous. The percent difference was within a reasonable range, and therefore the slight difference in the values can be attributed to errors in the experiment. Possible sources of uncertainty in the experiment could be that the tracks are not perfectly frictionless. This could affect the data by reducing the velocities of the carts as they approach and exit out of the collision, and would therefore additionally reduce the amount of momentum in the cart-cart system. Another possible source of uncertainty is the accuracy of the video analysis software. If the video analysis was not perfectly accurate, it could have skewed the data by either adding or removing momentum to the cart-cart system.
| bouncy_collision__1_moving_.gif |
Trial 2 - Bouncy collision with both carts moving
Momentum Bar Chart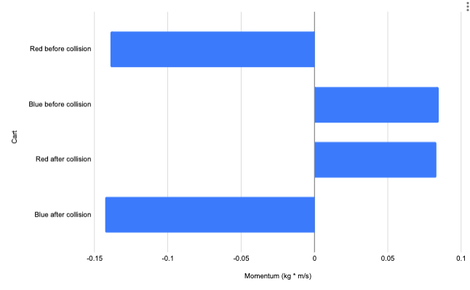
Momentum - Time Graph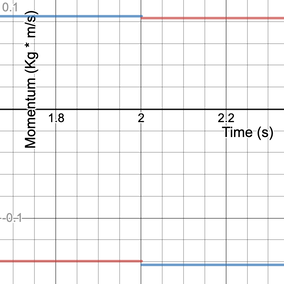
CalculationsLogger Pro Software was used to obtain the position of each cart at each measurement of time. Since the carts were sliding on a near-frictionless surface, after the carts were given an initial push they retained a relatively constant velocity until the collision. Due to this, a linear relationship was found on each cart before and after the collision, and the velocities in these segments were considered to be constant. The total momentum of the system should have been equal before and after the collision, shown by the equations (Pi = Pf) and (Ma * Vai + Mb * Vbi = Ma * Vaf + Mb * Vbf). After substituting in 0.252 kg for both Ma and Mb, since the carts had equal mass. In this trial, Vai = -05531 m/s, Vbi = 0.3367 m/s, Vaf = 0.3296 m/s, and Vbf = -0.5667 m/s. The initial total momentum is -0.0546 kg * m/s, and the final total momentum is -0.0597 kg * m/s.
|
Position - Time Graph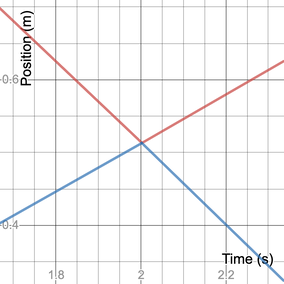
Net Momentum - Time Graph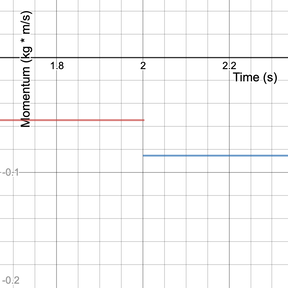
Percent DifferenceThe percent difference is a decent indicator on the reliability of data. The lower the percent difference, the lower the amount of error in the experiment and the more reliable the results. The equation to calculate the percent difference is ((|final momentum - initial momentum|) / initial momentum). To get the initial and final momentum, the two carts' momentum of either before or after the collision must be added. In this trial the initial momentum is -0.0546 kg * m/s and the final momentum is -0.06 kg * m/s. The percent difference in this trial was 9.89%.
|
Discussions
The objective of this trial was to see if momentum was conserved when a moving cart collided with another moving cart in an elastic collision. Using the slope of the lines in the position-time graph and the mass of the carts, a momentum-time graph could be created. From this, the total momentum before and after the collision can be found and put into a net momentum-time graph. If the momentum was completely conserved and the experiment was free from error, then the momentum before the collision would be equal to the momentum after the collision, and the net momentum-time graph would be continuous. However, this experiment was far from perfect and the graph was not continuous. The percent difference was within a reasonable range, and therefore the slight difference in the values can be attributed to errors in the experiment. Possible sources of uncertainty in the experiment could be that the tracks are not perfectly frictionless. This could affect the data by reducing the velocities of the carts as they approach and exit out of the collision, and would therefore additionally reduce the amount of momentum in the cart-cart system. Another possible source of uncertainty is the accuracy of the video analysis software. If the video analysis was not perfectly accurate, it could have skewed the data by either adding or removing momentum to the cart-cart system.
| bouncy_collision__2_moving_.gif |
Trial 3 - Sticky collision with one cart moving and one stationary
Momentum Bar Chart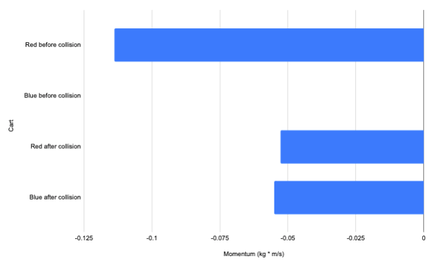
Momentum - Time Graph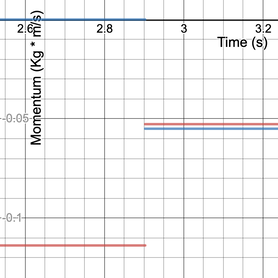
CalculationsLogger Pro Software was used to obtain the position of each cart at each measurement of time. Since the carts were sliding on a near-frictionless surface, after the cart was given an initial push it retained a relatively constant velocity until the collision. Due to this, a linear relationship was found on each cart before and after the collision, and the velocities in these segments were considered to be constant. The total momentum of the system should have been equal before and after the collision, shown by the equations (Pi = Pf) and (Ma * Vai + Mb * Vbi = Ma * Vaf + Mb * Vbf). After substituting in 0.252 kg for both Ma and Mb, since the carts had equal mass. In this trial, Vai = -0.4515 m/s, Vbi = 0 m/s, Vaf = -0.2093 m/s, and Vbf = -0.22 m/s. The initial total momentum is -0.11378 kg * m/s, and the final total momentum is -0.1077 kg * m/s.
|
Position - Time Graph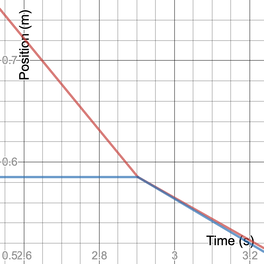
Net Momentum - Time Graph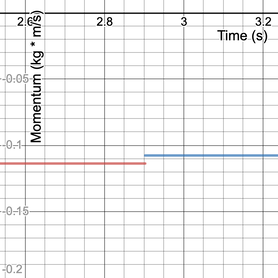
Percent DifferenceThe percent difference is a decent indicator on the reliability of data. The lower the percent difference, the lower the amount of error in the experiment and the more reliable the results. The equation to calculate the percent difference is ((|final momentum - initial momentum|) / initial momentum). To get the initial and final momentum, the two carts' momentum of either before or after the collision must be added. In this trial the initial momentum is -0.11378 kg * m/s and the final momentum is -0.1082 kg * m/s. The percent difference in this trial was 4.90%.
|
Discussions
The objective of this trial was to see if momentum was conserved when a moving cart collided with a stationary cart in an inelastic collision. Using the slope of the lines in the position-time graph and the mass of the carts, a momentum-time graph could be created. From this, the total momentum before and after the collision can be found and put into a net momentum-time graph. If the momentum was completely conserved and the experiment was free from error, then the momentum before the collision would be equal to the momentum after the collision, and the net momentum-time graph would be continuous. However, this experiment was far from perfect and the graph was not continuous. The percent difference was within a reasonable range, and therefore the slight difference in the values can be attributed to errors in the experiment. Possible sources of uncertainty in the experiment could be that the tracks are not perfectly frictionless. This could affect the data by reducing the velocities of the carts as they approach and exit out of the collision, and would therefore additionally reduce the amount of momentum in the cart-cart system. Another possible source of uncertainty is the accuracy of the video analysis software. If the video analysis was not perfectly accurate, it could have skewed the data by either adding or removing momentum to the cart-cart system.
| sticky_collision__1_moving_.gif |
Trial 4 - Sticky collision with both carts moving
Momentum Bar Chart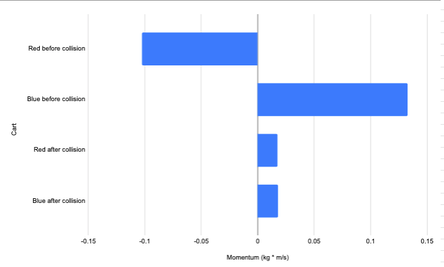
Momentum - Time Graph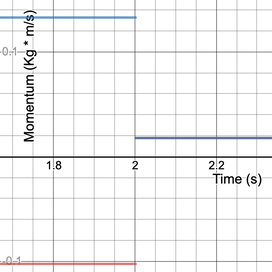
CalculationsLogger Pro Software was used to obtain the position of each cart at each measurement of time. Since the carts were sliding on a near-frictionless surface, after the carts were given an initial push they retained a relatively constant velocity until the collision. Due to this, a linear relationship was found on each cart before and after the collision, and the velocities in these segments were considered to be constant. The total momentum of the system should have been equal before and after the collision, shown by the equations (Pi = Pf) and (Ma * Vai + Mb * Vbi = Ma * Vaf + Mb * Vbf). After substituting in 0.252 kg for both Ma and Mb, since the carts had equal mass. In this trial, Vai = -0.4070 m/s, Vbi = 0.5275 m/s, Vaf = 0.0705 m/s, and Vbf = 0.0706 m/s. The initial total momentum is 0.03033 kg * m/s, and the final total momentum is 0.0355 kg * m/s.
|
Position - Time Graph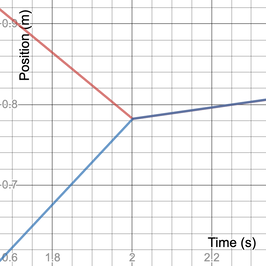
Net Momentum - Time Graph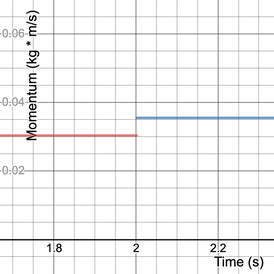
Percent DifferenceThe percent difference is a decent indicator on the reliability of data. The lower the percent difference, the lower the amount of error in the experiment and the more reliable the results. The equation to calculate the percent difference is ((|final momentum - initial momentum|) / initial momentum). To get the initial and final momentum, the two carts' momentum of either before or after the collision must be added. In this trial the initial momentum is 0.030366 kg * m/s and the final momentum is 0.0356 kg * m/s. The percent difference in this trial was 17.23%.
|
Discussions
The objective of this trial was to see if momentum was conserved when a moving cart collided with another moving cart in an inelastic collision. Using the slope of the lines in the position-time graph and the mass of the carts, a momentum-time graph could be created. From this, the total momentum before and after the collision can be found and put into a net momentum-time graph. If the momentum was completely conserved and the experiment was free from error, then the momentum before the collision would be equal to the momentum after the collision, and the net momentum-time graph would be continuous. However, this experiment was far from perfect and the graph was not continuous. The percent difference was within a reasonable range, and therefore the slight difference in the values can be attributed to errors in the experiment. Possible sources of uncertainty in the experiment could be that the tracks are not perfectly frictionless. This could affect the data by reducing the velocities of the carts as they approach and exit out of the collision, and would therefore additionally reduce the amount of momentum in the cart-cart system. Another possible source of uncertainty is the accuracy of the video analysis software. If the video analysis was not perfectly accurate, it could have skewed the data by either adding or removing momentum to the cart-cart system.
| sticky_collision__2_moving_.gif |
Trial 5 - Explosion of the two carts
Momentum Bar Chart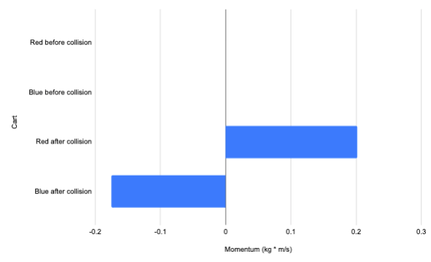
Momentum - Time Graph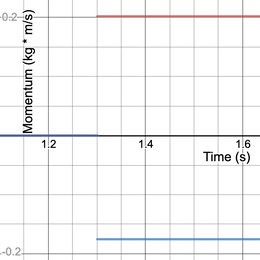
CalculationsLogger Pro Software was used to obtain the position of each cart at each measurement of time. Since the carts were sliding on a near-frictionless surface, after the carts were given an initial push they retained a relatively constant velocity until the explosion. Due to this, a linear relationship was found on each cart before and after the explosion, and the velocities in these segments were considered to be constant. The total momentum of the system should have been equal before and after the explosion, shown by the equations (Pi = Pf) and (Ma * Vai + Mb * Vbi = Ma * Vaf + Mb * Vbf). After substituting in 0.252 kg for both Ma and Mb, since the carts had equal mass. In this trial, Vai = 0 m/s, Vbi = 0 m/s, Vaf = 0.8014 m/s, and Vbf = -0.6959 m/s. The initial total momentum is 0 kg * m/s, and the final total momentum is 0.02655 kg * m/s.
|
Position - Time Graph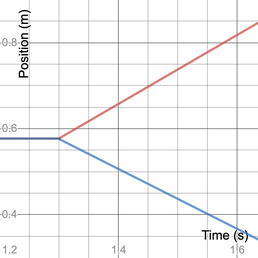
Net Momentum - Time Graph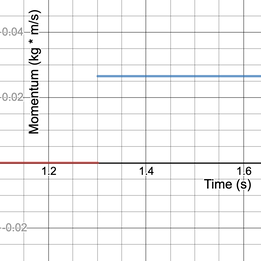
Percent DifferenceThe percent difference is a decent indicator on the reliability of data. The lower the percent difference, the lower the amount of error in the experiment and the more reliable the results. The equation to calculate the percent difference is ((|final momentum - initial momentum|) / initial momentum). To get the initial and final momentum, the two carts' momentum of either before or after the collision must be added. In this trial the initial momentum is 0.20195 kg * m/s and the final momentum is -0.1754 kg * m/s. The percent difference in this trial was 13.15%.
|
Discussions
The objective of this trial was to see if momentum was conserved when two connected carts experience an explosion and separate. Using the slope of the lines in the position-time graph and the mass of the carts, a momentum-time graph could be created. From this, the total momentum before and after the explosion can be found and put into a net momentum-time graph. If the momentum was completely conserved and the experiment was free from error, then the momentum before the explosion would be equal to the momentum after the explosion, and the net momentum-time graph would be continuous. However, this experiment was far from perfect and the graph was not continuous. The percent difference was within a reasonable range, and therefore the slight difference in the values can be attributed to errors in the experiment. Possible sources of uncertainty in the experiment could be that the tracks are not perfectly frictionless. This could affect the data by reducing the velocities of the carts as they approach and exit out of the explosion, and would therefore additionally reduce the amount of momentum in the cart-cart system. Another possible source of uncertainty is the accuracy of the video analysis software. If the video analysis was not perfectly accurate, it could have skewed the data by either adding or removing momentum to the cart-cart system.
| explosion.gif |
Widget is loading comments...
